A message to California home owners: If you burn gas for heating, going all-electric probably has a far greater energy and CO2 savings potential than rooftop solar.
Ideally you want to do both, but if you had to pick one, consider all-electric.
It Has Been a Long Road…
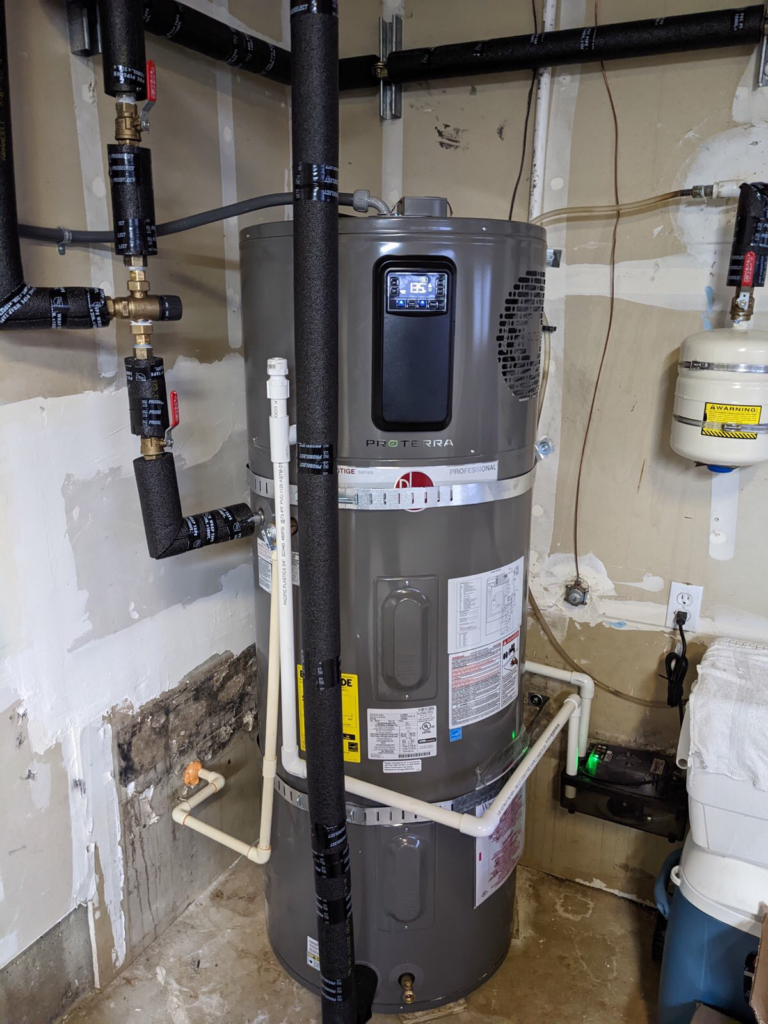
… but by the end of November we finally completed the “mostly electric” conversion of our home that I talked about here: The gas water heater that was on its last leg has been replaced by a heat pump water heater.
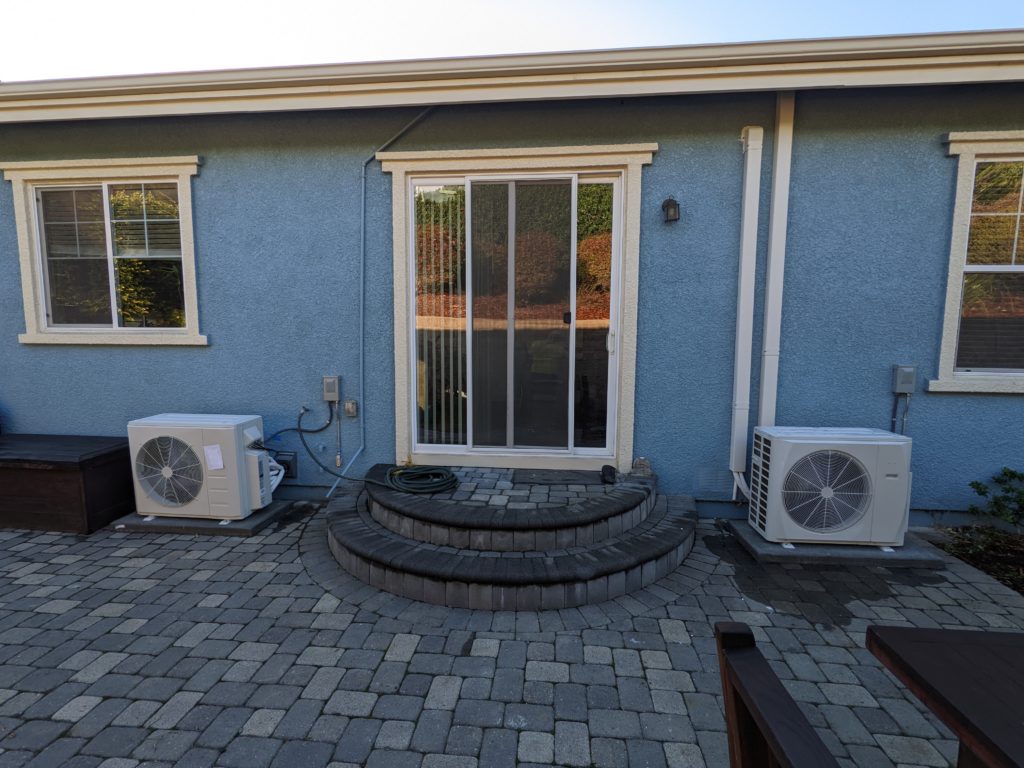
Our two equally old forced air gas furnaces and their leaky ducting have given way to two ductless mini-split units. Earlier in the year we already replaced a gas clothes dryer with an electric — but non-heatpump — one, so the only gas appliance that remains in use is a gas cooktop.
While dialing in the mini split systems was not without its challenges and warrants another post in the future, there are finally some numbers to compare: December 2022 was the first month after we went mostly-electric, and we also have numbers from a year earlier, for comparison.
Energy Savings
Looking at the energy we consumed in December 2021 vs 2022, it is clear that the overall usage for our home went down dramatically:
| Natural Gas (kWh) | Electricity (kWh) | Total (kWh) | |
| Dec 2021 | 6669 | 621 | 7290 |
| Dec 2022 | 44 | 1443 | 1487 |
Electrification is a clear win for energy savings: Overall, our energy usage decreased by about 80%.

CO2 Emissions — Guess The Numbers
We traded in almost completely eliminating the on-site burning natural gas for a 130% increase in electricity consumption. — What does this mean for CO2 emissions caused by our household?
Utilities Playing Number Games
The answer to that question depends on whose numbers you trust for the CO2 intensity of the power grid. The California Energy Commission requires all utilities in California to publish annual Power Content Labels.
The average CO2 emissions per kWh according to these labels varies wildly:
- The utility average for California is 456 grams per kWh.
- PG&E, who serves our region claims 98 grams per kWh for their base plan, while the tier with the lowest emissions clocks in at 58 grams per kWh according to PG&E’s 2021 Power Content Label.
- Marin Clean Energy, our CCA, claims 75 grams per kWh for their base plan, and 0 for their other “greener” plans, which are either a 50/50 mix of wind and solar or 100% solar, according to their label.
The fact that MCE claims to have plans that cause no carbon emissions and use 100% solar leads me to think that these numbers are largely accounting tricks: Marin county is not plastered with vast energy storage facilities that would allow us to run the grid off of solar energy 24x7x365.
There is also the fact that CO2 intensity of the power grid does not only vary by location, but also by time of day and most likely also by season. — But for a back of the envelope calculation let’s look at two cases that are probably a worst case and a plausible best case scenario for our location and see how these stack up.
Turns out we are still doing pretty good in both cases:
Worst Case: CA Utility Average
The CA utility average of 456 grams per kWh of electricity is still significantly worse than the 180 grams of CO2 per kWh of thermal energy that are emitted when burning natural gas.
However, the math still works out, given the large efficiency gains from heat pumps and other improvements to our building, such as air sealing and eliminating ducting losses:

Even with these numbers the all-electric conversion saves 55%, or about 825kg (about 1800lbs) of CO2 emissions from our home in December alone.
Best (Plausible) Case: MCE’s Base Plan
Obviously the numbers look significantly better using the average of 78 grams per kWh that our CCA advertised for their base plan in 2021:

With MCE’s numbers we see an emissions reduction of 90% or over 1100kg (about 2400lbs) of CO2 saved in December.
Caveats
The energy and CO2 emissions savings numbers in this comparison are ballpark figures. There are factors that could push the savings up, and other factors that could reduce them.
For example:
- Savings might be under-estimated because December 2022 was significantly colder than December 2021 (about 10% more heating degree days).
- Savings might be under-estimated because improvements to the building envelope that are also in scope for the all electric conversion are not fully completed yet.
- Savings might be over-estimated because we drove our EV slightly less in December 2022 than in December 2021.
- Savings might be over- or under-estimated by using utility averages for carbon intensity, and not looking at hour by hour fluctuations or taking into account seasonal variations in the percentage of zero-emissions electricity on the grid. — If you are interested in learning more about this topic, this is a good read.
Also note that the numbers compared are for December only, but they appear to be in line with my initial estimates here.
Conclusion And Outlook
Despite all these caveats, it is without a doubt that going all electric substantially reduces the amount of energy used by the building, as well as the CO2 emissions it causes: An 80% reduction in total energy consumption and a reduction of emissions in the order of 55% to 90% for December is beyond any likely margin of error.
It is also worth noting that for our home the conversion to all-electric results in a significantly larger CO2 emissions reduction than adding rooftop solar would have done. — Had rooftop solar been added without an all electric conversion, the reduction in total energy usage would have been less than 10%, while the CO2 emissions reductions potential would have been less than 20% even in the best case, given the usage numbers for the month of December.
It should be interesting to see how things develop during warmer times of the year, when our main use of natural gas was for water heating, and cooling the building used to be done with a fairly inefficient AC.
February Update
Saving Dollars, Not Just Emissions
Utility Bill: 30% to 40% Down, Rather than 32% Up
By early February 2023 we have gotten both our December and January PG&E bills, and this shows that the conversion pencils financially as well. Year over year our December utility bill was down by about 40%, and the January bill was down by about 30%. Paying 30% to 40% less is significant given that PG&E claims that on average bills went up by 32%.
Watch your (Rate) Plan
For the first two months we stayed on the standard E-TOU-C rate plan. However, had we switched to E-ELEC, a tariff that is better suited for heat pumps and EV charging earlier, our December utility bill would have been cut in half.