It has been a couple of years since I wrote about The Case For An All Electric Home and shared the early results of our conversion in Finally Mostly Electric…. Back then, I was working with “back of the envelope” calculations and just a few months of data.
In 2024 we also installed a solar+battery storage system, and now that 2025 is in the past, we have a full year of granular data. Therefore I wanted to revisit my original assumptions and evaluate our home’s performance using the following three criteria:
- Carbon Footprint
- Energy Efficiency
- Financial Viability
The results reflect the core premise I’ve touched on before: electrification is the primary lever for carbon footprint reduction, but solar is what makes the transition financially viable in California’s current rate environment. Also, electrification dramatically reduces the amount of energy consumed.
Carbon Footprint: Electrify Everything!
In my earlier posts I’ve tried to estimate the impact of electrification on CO2 emissions by guessing annual utility-averages, as well as estimates for our annual usage. Now that we have detailed data from the energy monitoring equipment that came with our solar+battery installation, we can calculate our home’s CO2 emissions more precisely, using actual hour-by-hour numbers for CAISO grid CO2 intensity data1 and our own energy production/consumption.
I’ve decided to compare three different scenarios:
- Fossil Baseline: Our home as it was in 2022, with an aging forced air gas heating system, no solar, and no other optimizations such as air sealing and upgraded attic insulation. Rather than guessing, this scenario uses our actual 2022 PG&E hourly electric and daily gas interval data as the counterfactual. Because 2025 was a milder winter than 2022, the 2022 gas heating and electric blower usage is mathematically scaled down month-by-month (using actual NOAA Heating Degree Days from the Novato station)2 to represent exactly what our 2022 home would have consumed in 2025 weather. For a complete comparison, we also assume we would be driving a gasoline powered SUV getting about 25mpg.
- All-Electric Grid: Our home as it is today, fully electrified but without solar, using mini splits for heating and cooling and a heat pump water heater. We are also factoring in the impact of driving an electric car that gets about 3.2 miles per kWh.
- All-Electric Solar: Same as above, but factoring in the influence of our solar and battery installation.
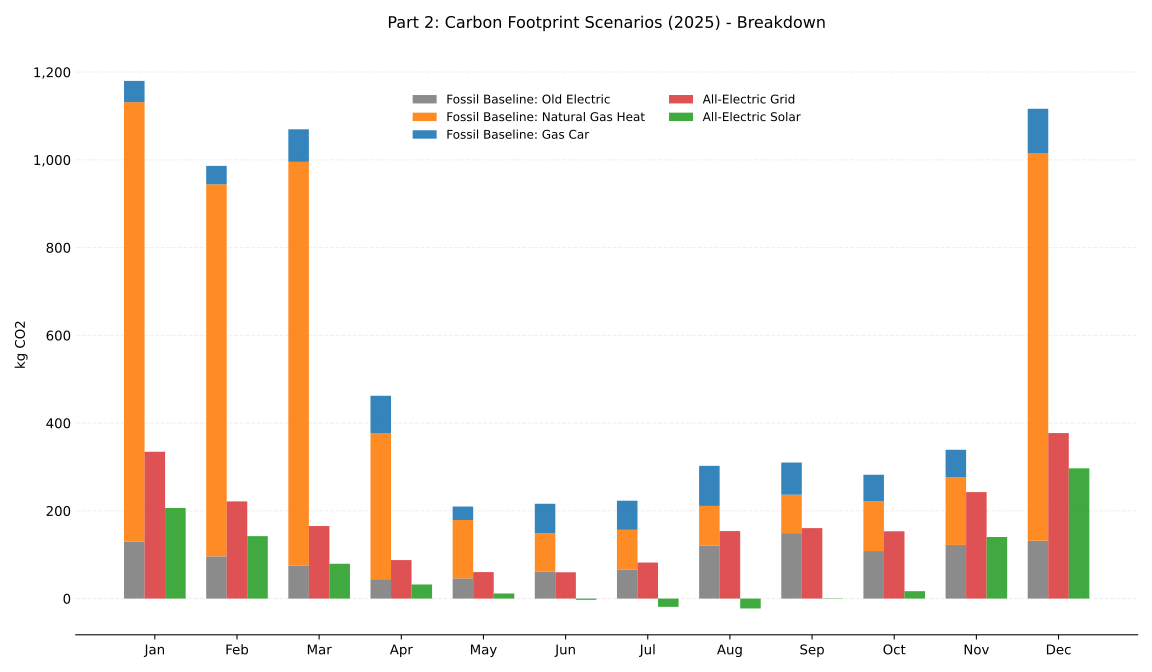
Looking at these three scenarios, switching away from burning natural gas has the biggest impact on carbon footprint reduction by far. Because we don’t drive as much as a typical California household (only about 2,000 miles a year compared to the state average of over 11,000)3, the EV’s footprint reduction is actually secondary for us.
The most important take-away is that even without solar, pulling every kWh from the grid, our carbon footprint would have dropped from 6.70 metric tons (the “Fossil Baseline”) to 2.10 metric tons.
With our solar array and battery storage factored in, the net footprint for the year is lower still, at 0.88 metric tons. The reason this isn’t closer to zero despite being nearly net-zero for the year is the timing: we export clean energy during the day but still import more carbon-intense grid power at night and in the winter. While our battery effortlessly shifts daytime solar to cover the daily evening peak, a home battery simply cannot bridge the gap of multi-day winter storms when heating demand peaks and solar production plummets.
To spell this out:
- Fossil Baseline: 6.70 metric tons
- All-Electric Grid: 2.10 metric tons, or 31% of baseline
- All-Electric Solar: 0.88 metric tons, or 13% of baseline
Energy Efficiency: Doing More with Less
The energy savings are also substantial. Electrification alone cut our total site energy demand by 66%.
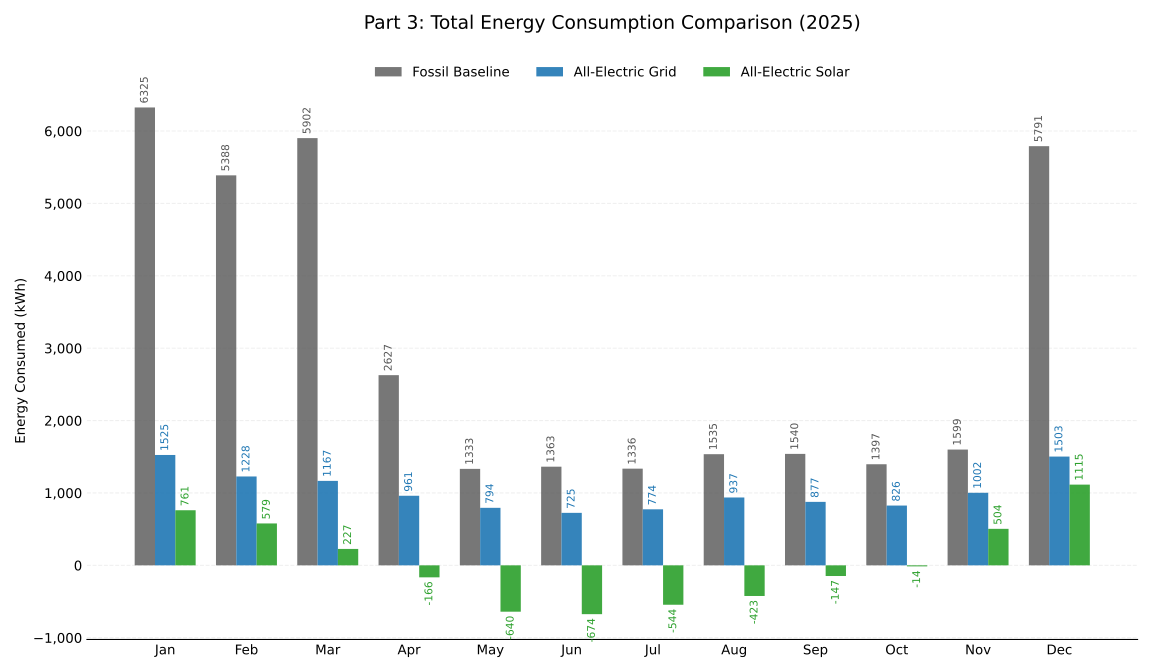
Moving heat (via heat pumps) is simply more efficient than creating it (by burning gas). We went from potentially consuming ~36,100 kWh equivalent in a fossil scenario down to ~12,300 kWh of actual electricity for the whole home and car. Because of the solar production, the net energy import from the grid was only 576 kWh for the entire year.
Here is the breakdown by the numbers:
- Fossil Baseline: 36,135 kWh equivalent
- All-Electric Grid: 12,319 kWh, or 34% of baseline
- All-Electric Solar: 576 kWh, or less than 2% of baseline
The Financials
Ever-Shifting Math
When I first ran these numbers in early 2022, the “electrification only” scenario looked like a clear financial winner even without solar. My assumption then was that we’d save about $1,300 a year just by going all electric.
Looking back, that assumption was actually true at the time.
In late 2022, PG&E electricity was averaging around 34 cents per kWh, while natural gas was about $2.70 per therm. That “spread” was wide enough for the 3x efficiency of a heat pump to easily outrun the cost of the gas it replaced.
Fast forward to 2025, and the math has shifted:
- Electricity Rates: Have surged by over 30% since late 2022, with average residential rates now around 45 cents per kWh.45
- Natural Gas: Has increased by about 9% in the same period.6
This disproportionate hike in electric rates has significantly narrowed the efficiency margin. What was once a comfortable $1,300/year advantage has shrunk to about $850—still a win, but a thinner one that makes a strong case for pairing electrification with solar.
Grid Rates vs. Solar Savings
This is where the 2025 data gets interesting. Because of those rate hikes, an all-electric home without solar would have cost us about $5,200 last year. However, if we had stayed on our fossil baseline, the combination of gas for heating and gasoline for the car would have driven our total energy costs to $6,050.
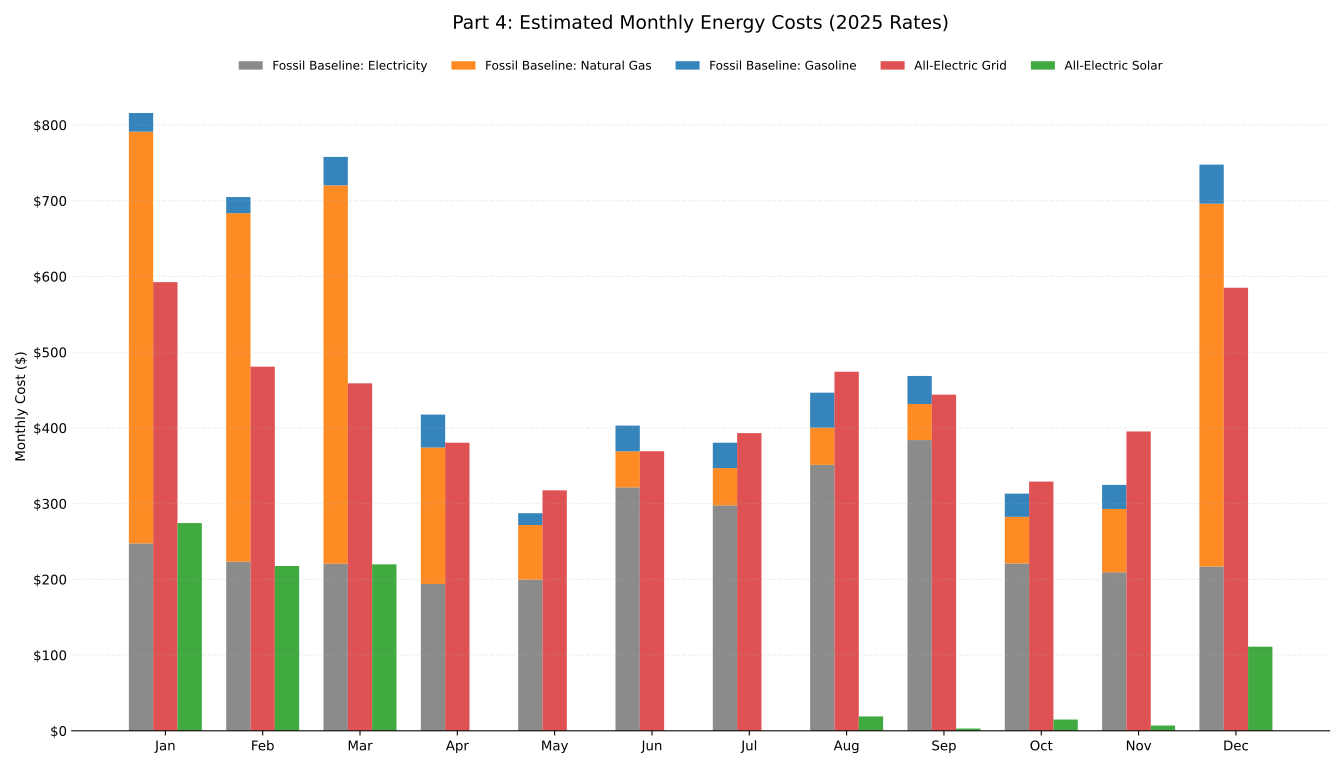
However, solar is what truly flips the script and unlocks massive savings. I’ve been tallying our actual PG&E bills for 2025 to keep the math honest. Between non-bypassable charges and the fact that MCE generation credits often can’t offset PG&E delivery charges, we ended up paying just over $1,000 for the year.
- Fossil Baseline: $6,050
- All-Electric Grid: $5,200
- All-Electric Solar: $1,000
Long-Term Outlook: 2030 and Beyond
As we’ve seen, electrification already saves us about $850 a year even after PG&E’s aggressive rate hikes. Looking ahead, that margin is likely to widen rather than shrink.
On the electric side, PG&E’s 2027-2030 General Rate Case proposes annual increases of about 3.5%, or roughly 15% cumulative over the four-year period.7
Natural gas, however, faces pressure from multiple directions. PG&E’s same GRC outlines an ~11% cumulative increase in gas delivery charges.7 On top of that, the planned expansion of U.S. LNG exports is tethering domestic gas prices to global market rates. The 2024 California Gas Report8 projects wholesale prices in California could nearly double, from about $3 to $5–$6 per MMBtu by 2030. Since the gas commodity accounts for about 15-20% of a residential PG&E bill, this translates to an additional 15-20% increase. Combined, residential gas rates could surge by 25-30% by 2030—significantly outpacing electricity.
Projecting our house’s specific consumption into 2030:
- Fossil Baseline: $7,250 (Electric: $3,550, Gas Heat: $3,300, Car: $400)
- All-Electric Grid: $6,000
- All-Electric Solar: $1,150 (assuming a 15% increase on our current ~$1,000 net PG&E bill)
By 2030, the savings from electrification alone would grow to over $1,200 a year. But the real value of our solar and battery system isn’t just the additional savings—it’s cost certainty. Grid and gas rates will continue to fluctuate with global events and regulatory decisions. Our core energy costs are largely locked in, turning what would be a $6,000+ annual variable expense into a roughly predictable $1,000 one.
Summary
Looking at the three scenarios, the division of labor between our upgrades is clear:
| Metric | Fossil Baseline | All-Electric Grid | All-Electric Solar |
|---|---|---|---|
| CO2 Emissions | 6.70 metric tons | 2.10 metric tons | 0.88 metric tons |
| Net Energy (Site) | 36,135 kWh | 12,319 kWh | 576 kWh |
| Annual Cost | $6,050 | $5,200 | $1,000 |
Electrification is what drives the massive reduction in CO2 and energy consumption. Solar is what makes those environmental gains financially sustainable.